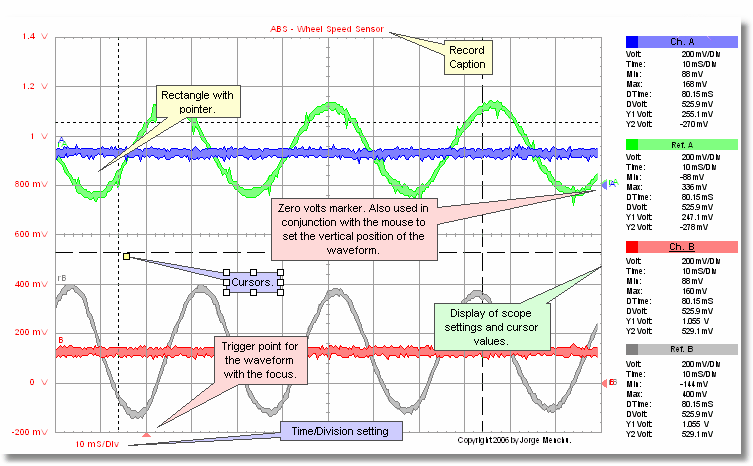
The Analysis screen facts:
| • | Displays up to 4 waveforms at one time. |
| • | Displays the waveforms from a given record. (At this time can not mix waveforms from other records.) |
| • | Each waveform can be vertically positioned. |
| • | Each waveform can be hidden. |
| • | The displayed grid values are for one waveform at a time. In the picture below it is Channel B the red waveform. |
| • | Cursors can be used to do time and voltage measurements. |
| • | The horizontal trigger position is displayed for each waveform. (The intersection of the trigger marker's horizontal position and the waveform is the actual trigger position.) |
| • | The waveform display is scalable by resizing the program window. |
| • | All colors of the display can be changed as well as the grid style. |

Note: All of these annotation were made with the AES Setup Shooter.