| Manufacturer |
| |
|
-------------------------------------
|
|
Tech Notes (1 of 3!)
This section provides you the opportunity to
share your favorite diagnosis or interesting waveform capture with other AES customers.
We welcome you to
submit your favorite experience captured with your
scope or the AES Wave!
Catch a Wave!
Tech Note 010:Testing Nissan Ignition
Submitted by Tom Roberts
I often see questions over e-mail about testing
Nissan distributor-power transistor ignition so I thought a post on this subject was in
order. There are a lot of these on the road and for the most part it is a dependable
system, but age takes its’ toll. I thought I would share with you the techniques I
use to zero in on the problem along with some helpful pictures.
The system is rather simple, with few components,
and is best tested with the DSO. Basically, the trail starts at the distributor, which
houses the optical crank angle sensor. This sensor is an LED and collector, separated by a
rotating disc with many slots. The signal strategy is, as with many optical distributors,
a high and low resolution signal pair. These signals are digital square wave signals. The
high resolution signal has a voltage transition for each degree of crankshaft rotation, so
it is called the 1 degree signal. Each voltage transition high and each low represents one
degree. The low resolution signal has one signal cycle (positive and negative transition)
for each cylinder. So, on a four cylinder this would be the 180 degree signal, since a
cylinder is up every 180 degrees, and on a six cylinder it would be the 120 degree signal.
Here is an example of a good CAS 180 and 1 degree signal relationship:
And here is an example of a 120 and 1 degree
relationship:
The low resolution signal usually has a wider sync
pulse, carbureted or fuel injected. Here is a capture of the wider sync slot in a 120
degree signal:
These signals are processed by the ECU along with
other inputs for spark timing. The ECU then sends out a command signal to the power
transistor, which controls the coil primary. Here is a capture of the relationship between
the CAS 180 degree signal and the power transistor command. Here also the wider sync
pulses can be seen in the 180 degree signal.
Here is an example of the relationship between the
power transistor command and coil primary:
And this is an example of what happens to the power
transistor command when there is a 180 degree signal failure:
Here is an unusual 180 degree CAS failure which
became a mirror of the 1 degree signal:
And here is an example of a high rpm CAS 1 degree
signal failure. This one had a symptom which mimicked valve float. The symptom could only
be duplicated at high rpm. The engine would begin to backfire in the intake and bog down,
as the spark command failed due to the 1 degree signal failure.
The power transistor command looks quite different
when it is not interacting with the transistor. Here is a capture disconnected from the
transistor:
This is important to note since it can indicate a
failed transistor. Here is an example of a failed transistor from an 8 plug Z24 pickup:
Keep in mind that the eight plug systems do not
trigger the exhaust side ignition under certain load and rpm ranges. That’s why
secondary ignition problems on the intake side usually show up under load. So don’t
be surprised to see the power transistor command disappear under these conditions.
To solve ignition problems reliably on these, all
you need is some basic knowledge of how the system works, some diagrams, your scope, and
your instincts. Just follow the electronic trail to the source of the failure. This works
in almost all cases, but you can’t win ‘em all. Case in point, an ‘88
Pathfinder with a very weak spark which would not start. Good primary pattern could be
seen and the coil wire was OK. Conclusion, bad coil. WRONG. A failed power transistor was
the culprit. Here’s the pic:
Now when I encounter weak spark on one of these,
before I condemn the coil, I try to do a primary current check as well as primary trigger.
Here is an example of a Maxima no-start due to weak spark, showing good primary trigger
and current:
A new coil is all that was needed.
I hope it has been helpful to share some of this
with all of you. I welcome any additional comments or techniques. I don’t mean to
make this seem simplistic. I would be the first to admit that some of these can drive you
nuts. Duplicating and capturing the failure is sometimes quite difficult, and seemingly
unexplainable things do occur. But I have found that this strategy works well for me in
almost all cases. I have learned so much from iATN, I thought I would just try in some
small way to contribute. Even though this is probably old news to most of you, I’m
sure some can benefit.
Tom Roberts
|
|
Back to Top
|
|
| Tech Note 009: Using
an Amp Probe with your DSO
Submitted by Bill Lakow
What not to Test with an Amp Probe
Most vehicle PCM input signals do not produce enough current to test with a
current probe, it is best to view the voltage trace of those signals.
Test These Instead
The engine management signals that we want to test with the milliamp probe
are the output signals that control solenoids, motors, and relays.
The milliamp probe can be used for testing fuel
pumps and other low current electric motors. Ignition coil current can also be tested with
the lab scope.
Most dual-channel scopes will allow you to view
ignition coil current and secondary voltage at the same time with the help of an amp
probe.
If you have the Interro PDA allow you can
view these signales by using the Scope Channel in the Engine Test menu.
Figure 1 below, is a new
fuel pump voltage and amperage trace on a GM CMFI system. This system requires a minimum
of 8.5 amps.
Figure 2 below, voltage signal is
good and the amperage signal is faulty. The fuel pump motor has an open circuit and the
vehicle had a loss of power.
Figure 3 below,
displays secondary ignition and coil current. This screen captured the crossfiring in the
secondary and verified that the coil triggering was not at fault.
The milliamp current probe allows quick and accurate
non-intrusive testing.
Test good to know good. Test good current
signals and note their shapes and amplitude and then make them "bad" and note
the changes in the signal. |
Related AES Links:
• Low Current Probes
• Interro PDA |
Back to Top
|
|
| Tech Note 008: Injector
Drivers
Submitted by Tom Roberts
I thought I would post this short article on
injector drives so those of you who are new to DSO technique and any others interested
might benefit from my relatively limited knowledge and open up some feedback and
discussion which would enrich all of us. Observing injector waveforms for the first time
can be somewhat confusing. Hopefully this information will help to make things clearer and
speed things up on the road to proper injector diagnosis.
Injector drive types can be divided into three
categories:
1. Saturation
2. Peak and hold
3. Pulse width modulated
In each category there are two styles: positive and negative control.
All electronic injectors I know of fall into these categories.
Saturation (or conventional) Drivers
Since this type has no current limit feature, injectors using this method
usually have higher resistance or added circuit resistance. When voltage is supplied to
the injector circuit and the driver provides the ground to flow current through the coil
and open the injector, it is negatively controlled. Here is an example:
Most of the drivers in this category are port fuel
injected.
This, however, is a Nissan Sentra TBI. The
injector is low resistance but there is a resistor in the circuit to reduce current flow.
When the ground is supplied to the injector and the
driver provides the power the picture is a little different:
To acquire the pattern the scope must be on the
control side of the injector.
Peak and Hold Driver
This type of driver peaks current to open the injector and then limits
current to only what is needed to hold it open. Here is an example of a negatively
controlled peak and hold driver:
Here is an example of a positively controlled
driver:
Most TBI injectors fall into this category. When
measuring pulse width on these, measure from the beginning of the peak section to the end
of the hold section as the cursors show.
Pulse Width Modulated
This type of driver peaks to open the injector but has a different current
limiting strategy. Instead of a steady hold section, it turns the current on and off very
rapidly or modulates it. Here is an example of a negatively controlled pulse width
modulated driver:
Below is a positively controlled pulse width
modulated driver:
Here, you should also measure pulse width from the
beginning of the peak section to the end of the pulse modulation section as the cursors
show.
There are some interesting combinations too. Honda
civic dual TBI units use an auxiliary injector which has a saturation driver and a main
injector that uses a pulse width modulated driver. The names seem backwards though, for
the auxiliary injector is used all the time and the main injector comes in under light to
heavy load conditions. It is not active at idle. Here is an example of both injectors
under light load cruise. The top is the Auxiliary and the bottom is the main:
Here is the same under acceleration. Note the added
quirk of a current limit hump in the peak section of the main driver.
Common Failures
I thought I would also include a few common failures that can be recognized
from the DSO trace. GM TBI peak and hold drivers often fail to control the hold section.
This is usually a progressive failure. In the early stages the hold section gets wavy
under acceleration. The owner may not notice any symptoms at all. Later if the driver
degrades more, symptoms vary from rough idle and hesitation to extreme roughness and black
smoke. I have noticed that if one driver in a dual TBI unit is blown and the other is not,
symptoms seem to be worse.
Below is an example of a badly blown driver:
There are varying opinions about the seriousness of
this failure. I have found that the symptoms are inconsistent with the seriousness of the
pattern degradation. In this example, the symptoms were serious.
Unbalanced injection and resulting lean misfire with
ECM compensating for resulting O2, creating a rich condition at times. Others I have seen
in similar shape have no symptoms. Basically I am saying not to blame symptoms on this
failure alone. What I do if I suspect that this is a possible cause is to install a .1mfd
capacitor (Radio Shack # 272-1053) across the injector. This will clear up the pattern. If
the symptoms are still there then move on. If that fixes it, then you just have to decide
to leave it at that or replace the ECM. Often rebuilt ECM's have similarly blown drivers
in them already.
Shorted GM Multec injectors are common as well. The
give away in the pattern is a high ground offset (the distance from the lowest point to
ground), and low comparative inductive kick (spike when injector shuts off). Ground offset
should be generally within 800mv of ground. The spike varies by application so compare
this to others. Some ECMs will shut down when injector current gets too high to keep from
going up in smoke.
Below are a couple of examples of shorted injectors
with saturation drivers:
Below is a Quad four example of a shorted injector
with a peak and hold driver. Here add to ground offset and inductive kick problems the
time of the peak section before the ECM begins current limit hold section. Also note the
oscillations in the hold section:
And the good driver for comparison:
Remember that when one shorted injector steals the
current from others in parallel the good injectors may be the ones misfiring.
Another common failure cannot be identified with a
scope. Failed injector patterns look identical to good ones, resistance and current is the
same. This failure is most common on Chrysler 2.2 and 2.5 TBI. Symptoms are stalling at
idle, hesitation aggravated when cold usually. You will see the injector spray sputter or
stop during the event. The engine can be made to stall lean by squeezing the return line
to raise fuel pressure. A new injector clears this up.
I hope this is of some help to a few of you who
might be new to this DSO stuff, or maybe just don’t use it a lot. |
Related AES Links:
• Peak and Hold Waveform Manual
• Waveform Reference Manual |
Back to Top
|
|
Tech Note 007:How to view alternator ripple
(diode patterns) with the Vantage® PGM.
Submitted by Brad Petersen
The Snap-on Vantage is a great tool with many
productivity enhancing features, such as, vehicle specific information and test setups.
One test setup not listed on the Vantage PGM is one for
testing alternators. Did you ever wonder why? Well, it is because the Vantage PGM does not
have AC Input Coupling and cannot process this signal in such a way to make it useful for
diagnosis.
AC Input Coupling filters out the DC (steady) portion of
a signal allowing only the AC (always changing) portion to appear on the display of the
test equipment. Many scopes (Fluke 98, Interro PDA, OTC Perception) provide AC Input
Coupling and can be used to test alternators with a set of regular test leads.
But, when you combine a special type of test lead and the
correct test setup with the Vantage PGM you can view the alternator ripple.
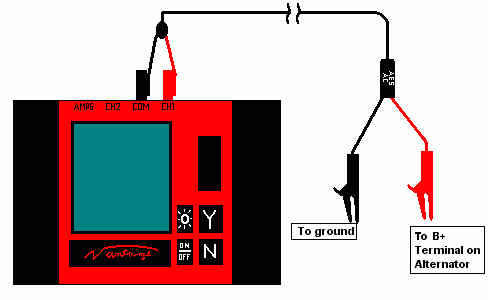
The example below illustrates how to setup the Vantage
PGM to test alternators with a special test lead that includes an in-line filter.
The test lead picks up the signal and delivers it to the
filter which blocks the DC (steady) portion of the signal and only allows the AC (always
changing) portion to reach the Vantage PGM and be displayed on the screen. Combined
with the correct setup on the Vantage PGM you will be able to view minor voltage changes
in the AC signal without regard to the DC portion of the signal.
This special test lead effectively provides AC Input
Coupling for the Vantage PGM and expands its testing capabilities.
Vantage Setup
The following is a pictorial sequence created by Brad
Petersen for using your Vantage PGM (Version 2 software) to look at the alternators
Brad created these graphics in MS Paintbrush, so some of
the images may not look exactly the same as the display on your Vantage.
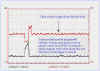
Connecting the AES AC PASS FILTER
This is the setup used to check Alternator ripple (Diodes), using the AES AC Filter Test
Lead.
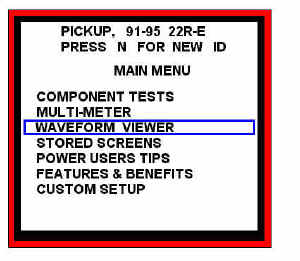
MAIN MENU SELECTION SCREEN
After hitting "N" after the first
power on screen, you should come to this screen. Scroll down and select Waveform Viewer.
WAVEFORM SETUP SCREEN
After selecting Waveform Viewer, this menu comes up.
Select AC Pulse Generators, High Frequency, as shown.
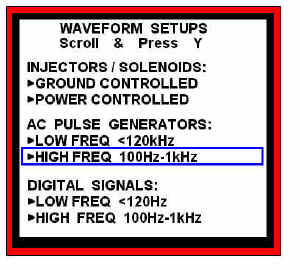
HIGH FREQ SCREEN SETUP
After selecting AC Pulse generators, High Frequency, the waveform viewer defaults
to this screen. Scroll through and select the time base, hit "Y" and scroll to
change the time base from 100ms to 10ms. Then scroll each, to the Upper and Lower voltage
ranges, hit "Y" and scroll to change the voltages to +1 and -1 and hit
"Y" on each. This will set the Vantage to 10ms sample, within the ranges of +1
to -1 volts. The Vantage is now ready for viewing the Alternator ripple (Diode pattern).
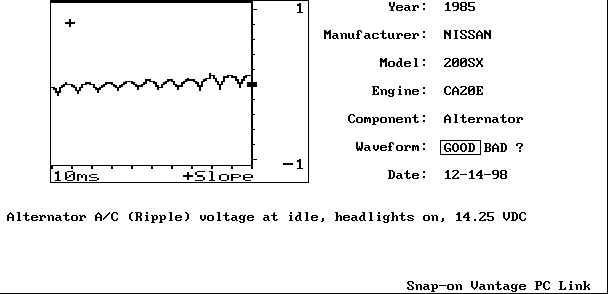
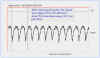
A GOOD SAMPLE WAVEFORM
Just a snap shot of a known good alternator as seen
by the Vantage. Note: Using waveform viewer in low frquency A/C pulse generator mode will
yield a good image of the diodes/ripple. AC Pass filtered lead set used, taken at
alternator B+ post.
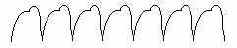
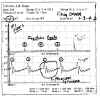
A HAND DRAWN SAMPLE OF BAD WAVEFORM
Would have been taken at the B+ lug on the back of
the Alternator, using the A/C pass filter, Vantage set on Waveform Viewer, A/C High
frequency.
Note: this was not an actual waveform, but a re-creation
done in paintbrush for simulation purposes.
Hope this helps.
Brad Petersen |
Back to Top
|
|
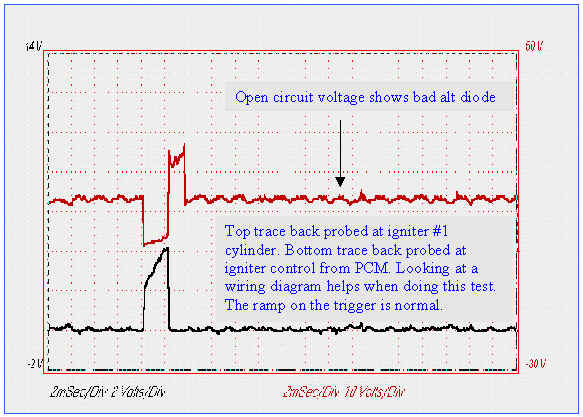
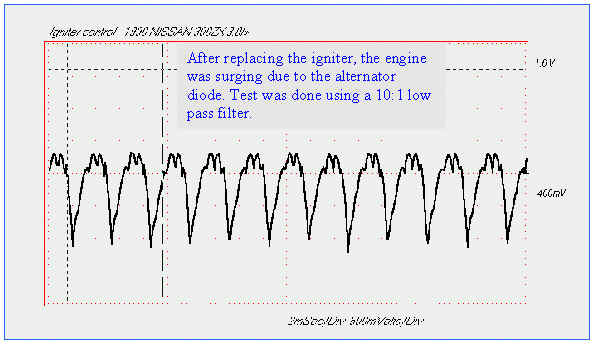
Tech Note 006:
Coil over Plug Ignition
1990 NISSAN 300ZX 3.0L NONE TURBO
Submitted by David Goldberg
The customer that owns this car drove in
complaining of stalling and hard starting after the engine got hot. The engine started and
ran fine stone cold. When it reached operating temperature, the engine would start
misfiring. Cooling the igniter down with a choke tester restored the ignition. After
replacing the igniter with an updated unit, the bad alternator diode was found.
The culprit is exposed:
|
Back to Top
|
|
Tech Note 005:
5 Critical Sensors for
Correct Engine Response
Submitted by Jerry Truglia
O2 SENSOR:
A. 0-1000mv=1 volt, range. Some sensors may go to 1.2 volts.
B. Some sensors are heated using system voltage. Be careful if you get a
high voltage reading on the signal line. This may occur if there is a problem in the
heater part of the sensor.
C. Renix systems use 5 volts to 0 volts (5volts lean, 0 volts rich).
D. Check with KOEO to see that you have approximately 450mv on a zirconium
sensor, 1volt or 5 volts on titania sensors. Use a Scanner, DVOM or Labscope to test the
sensor.
LOAD SENSOR:
A. Map Analog used by GM, Chrysler, Honda, Toyota and other Asian
manufactures as well as European manufactures.
B. Map Digital used by Ford.
C. Vane Air flow meter used by European, Asian and Domestic manufactures.
D. Hot Wire used by many manufactures.
E. Film Type used by Bosch and GM.
F. Honeycone type used by Mitsubishi.
TPS:
Variable resistor sensor that control fuel delivery by throttle
movement.
A. Check the sweep with a labscope to see if you have a drop out.
B. Any problem with this sensor can cause a hesitation or stumble.
C. Check this sensor in a no start conditions because of clear flood voltage
levels.
CTS / IAT: Coolant and Intake Air
Temperature sensors. A. Most of these sensors are the NTC negative temperature coefficient
type (high voltage and resistance cold, low hot). B. These sensors control fuel delivery
and are important for proper fuel delivery.
ENGINE SPEED:
A. AC Voltage type, most of the time two wires sensor although some will
have a third wire for shielding.
B. Hall Effect, a three wire sensor that uses power ground and signal which
produces a square wave.
C. Optical, uses four wires one power, ground, low data and high data rate
and produces two square waves.
D. All of these sensors control fuel and spark on today’s vehicles and
are used by the vehicle manufactures.
To test the above sensors you can use:
1. a scan tool to see if the computer is displaying rpm on the scan tool.
This will telling you a signal is being produced and getting to the computer.
2. a DVOM to check AC voltage or DC voltage on Hall and Optical, but this
will not be as accurate as using a labscope.
3. a labscope will give you a picture of what is really happening and the
ability to see small dropouts, you know a picture is worth a thousand words.
It’s a good idea to have a
software program to store waveforms to compare it to the signal that you have on your
scope from the vehicle. I recommend using the AESWAVE program, it’s easy to use and
communicates with most scopes and scan tools. Check it out, as Jorge would say, Catch the
WAVE.
AES Wave Note: Do the
following to save text into your AES Wave! database(s):
1. Select the text you want to copy by clicking and dragging your mouse over the
text you want.
2. If you are using MS IE you can right-click the mouse to select the COPY
command. You can also select the EDIT / COPY command from the menu. I assume
this method will work with the NetScape browser.
2. Open your AES Wave! database and click EDIT / PASTE on the menu bar. The text
should appear in a window.
3. Then click on the SAVE to DB icon and enter all the info you can.
NOTE: You use this same method to copy text from any other Windows program.
|
Related AES Links:
• Waveform Reference Manual
• Advanced Engine Performance
• JENDHAM
handbooks and Traning Manuals |
Back to Top
|
|
Tech Note 004:
Vacuum Waveform Case
Study
Submitted by Jack Dilger, Emissions Systems Inc
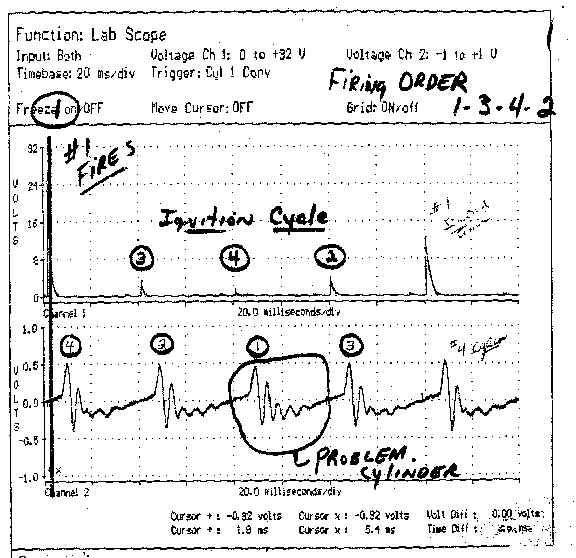
The Car:
1988 Honda Accord, 2.0 L 4 cylinder engine, 56,000 miles
The Problem:
Engine has slight "puff' at tailpipe and is due its 60,000 mile service.
Valve train is slightly noisy. Scope pattern shows slightly erratic secondary ignition
display and visual inspection of spark plugs show replacement is needed. Vacuum waveform
shows a different pattern consistently below cylinder #4 firing spike (see figure below).
Companion cylinder is determined to be cylinder #1. #1 is repeated
and verified by moving trigger clip ( ch 1 ) to cylinder #4 and going to single trace (see figure below).
Static compression test is performed to test cylinder sealing and
running compression test is performed to confirm cylinder breathing.
Results:
Static (cranking 3 puff )
1=160 2=165 3=160 4=145 PSI
running (scrader pushed in)1=100 2=80
3= 80 4=75 PSI
Problem has been located (using the vacuum waveform) and verified using the compression testing above.
Running compression should always be approx. 1/2 of cranking,
compression
The fact that #1 cylinder shows a higher than normal increase
proves that the vacuum waveform is correct in its pattern of a different pulse on this
cylinder. This vehicle needs a basic "tune-up" and a very much needed valve
adjustment.
We will advise the results of the valve adjustments at a later
date.
Click on the image to view
full size:
AES Wave Note: Do the following to
save images into your AES Wave! database(s):
1. If you are using MS IE you can right-click most any of image and select
COPY. I have not determined how to do this with NetScape.
2. Open your AES Wave! database and click EDIT / PASTE on the menu bar. The image
should appear in a window.
3. Then click on the SAVE to DB icon and enter all the info you can.
|
Related AES Links:
• Fluke Pressure & Vacuum
Transducer |
Back to Top
|
|
Tech Note 003:
Fuel Injector Signals
Submitted by Bill Lakow
Fuel injector signals have a few
different characteristic shapes. The majority of injectors are ground controlled. Voltage
is supplied to the injector when the ignition is on and the PCM controls the injector on
time by completing the circuit to ground.
There are a few manufacturers that turn the injector
on by supplying voltage through the PCM.
All of the waveforms (eight of them) presented below
are typical good signals.
Fig 1 Saturation Inj.
Fig 2 (below) Saturation Inj.
Fig 3 (below) Peak and
Frequency Modulated Hold
Fig 4 (below) Peak and
Frequency Modulated Hold (PNP Driver)
This injector is normally grounded and activated by supply voltage.
Fig 5 (below) Peak and frequency modulated hold, used on some GM throttle body
systems.
Fig 6
(below) displays the injector current and voltage traces
Fig 7
(below) displays the injector current and voltage traces
Fig 8
(below) displays the injector current and voltage traces
Helpful hint: Dynamic
testing with a milliamp current probe is faster and more accurate than static
testing with an ohmmeter. Use Ohm’s law to determine the proper current level. Adjust
the values for the number of injectors that are sharing each control circuit.
NOTE: Why are these waveforms
distorted? I do not know, I resized them to retain Aspect Ratio and they look fine
in my editing program. But when I see them online they become distorted. These were
sent to me embedded in a MS Word document and that could be part of the problem. If
you paste them into your AES Wave database(s) they should lose their distortion.
|
AES Wave Note:
Do the following to save these screen captures into your AES Wave!
database(s):
1. If you are using MS IE you can right-click any of the images
above and select COPY. I have not determined how to do this with NetScape.
2. Open your AES Wave! database and click EDIT / PASTE on the menu
bar. The image should appear in a window.
3. Then click on the SAVE to DB icon and enter all the info you
can. |
| Back to Top |
|
| Tech Note 002: Notes on AC Voltage
Submitted by Bill Lakow
Many lab scope signals may appear to be good
at a glance. However, your experience and closer examination of the trace will help to
evaluate the features of a trace that will lead to the cause of the problem.
Figure 1 and Fig.
2 are Ford PIP signals:

Figure 1 (Above) has noise
on the tops of the digital signals. The noise is caused by AC voltage riding on the DC
signal.
Figure 2 (below) is an
example of too much AC voltage that can interrupt the signal and cause a driveability
problem.
When AC noise is detected on a DC signal, test the
alternator ripple. With an Interro PDA, select the Diode Pattern test in the Engine Test
Menu and connect the current probe to either battery cable and record the ripple pattern.
With other scopes you need to enable AC input coupling.
With scopes and meters without AC input coupling you should use the AES AC Pass
Filter Test Lead, it filters the DC portion of the signal so you can view the AC
"always changing" portion.
Figure 3 and Fig. 4 are
Alternator Ripple patterns:
Figure 3 (Above) Bad
alternator ripple.
Figure 4 (below) Good
alternator ripple.
|
Related AES Links:
• AES AC
Pass Filter Test Lead
• Waveform Reference
Manual
•
Interro PDA Accessories
|
| Back to Top Tech Note Spacer |
|
| Tech Note 001: Jay Mathes
All Imported Auto, Ridgecrest, California
A 95 Kia Sephia came in with MIL on. (Only cust
complaint too.) P1523 which is a solenoid voltage below a threshold
(8.5V?). The customer felt that the diagnosis of a bad battery was out of line, so I
captured a simple waveform to show them (see Figure 1 below).
Figure 1
Static, KOEO, crank and start. It is clear that when
the batt voltage drops below 7V that this code is a given. Freeze frame showed cold,
0 MPH, and monitors were all pending indicating PCM reset. The car actually started
OK, although it was clear it cranked a bit slow.
Another use of a Fluke PV350 (or other pres/vac transducer)
is to have a cranking compression record of a vehicle. Easy to set up. I also
use this set-up without the schrader valve to see the three pulses on rotary engines (see Figure
2 below).
Figure 2
|
Jorge's Notes:
Jay ---- Great job! The waveform in Figure 1 and what you did with it is certainly one of
the key values of a lab scope: You used it to prove your diagnosis to the customer.
Showing them a DMM reading would not be the same!
This one also shows the value of
the record feature on the Vantage allowing you to scroll through the data to find the
important events!
Excellent vacuum waveform in Figure 2. This concept can go to the next step if you wish to identify the
cylinder/pulses. Use a trigger pickup on plug #1 to ID the pulses. The trigger pickup will
put out a spike every time #1 fires allowing you to ID and superimpose the events! Oh yes,
if #1 is firing which cylinder follows with an intake stroke?
Jorge
Related AES Links:
• Snap-on Vantage PGM
• Fluke PV-350
|
Back to Top
 |
Fluke 192
2-cl with glitch capture and record
Demo-it |
|
Electrical Troubleshooting
ShopBook |
|

HV Glove Kit
Keep Safe!
|
|

Flatrater Diagnostics
GM case studies |
|
Waekon
Probes and more |
|

Test Leads
Give your scope
new life! |
|
 |

|
|