When the waveform is longer then what can be displayed on the grid the Play controls are available to horizontally position the waveform. This is often the case with TREND PLOT or waveforms captured in the RECORD mode.
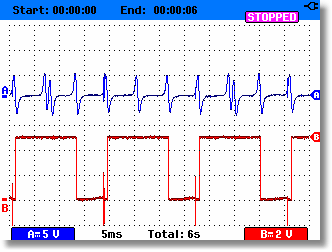
A recorded waveform can often be identified by the screen capture. Note the A and B labels on the right of the waveforms. For waveforms that are longer then the screen display the right side labels will be inside the "arrow boxes".

A long waveform is identified in the analysis screen by the availability of the Play controls - Toolbar button and the Tool bar alongside. Also, at the bottom right of the grid are will be displayed the total number of available datapoints and the range of the ones on the display.
Play Modes with the Play Menu
Using the Menu you can select play speeds. The actual speed will depend on your computer and how many waveforms and annotations are currently displayed.
Play Slow, Medium, or Fast Plays in a roll mode. The waveform will roll (or scroll) from left to right.
|
|
|
Play by Screen Updates on full screen at a time.
|
||
Play Modes using the Toolbar
Pressing the play toolbar button will play the waveform back the same as selecting the menu options PLAY | PLAY SLOW.
|
|
Using the scroll bar
Pressing an arrow button
The waveform will scroll in the direction of the arrow one datapoint at a time.
Pressing in the area between the slider and an arrow
Advances the waveform one grid full at a time.
Pressing and moving the slider
Advances the waveform by percentage
