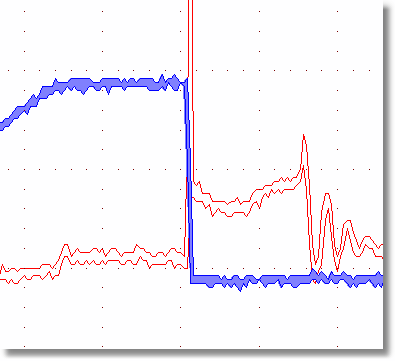
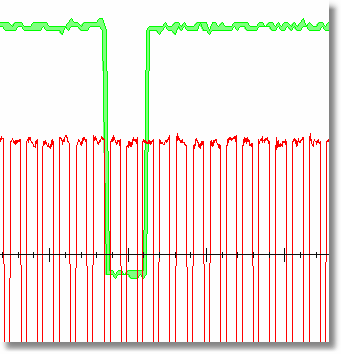
Some waveforms offer a trace for the minimum and maximum values. Some also include average. When min and max traces are available. When min and max datapoints are available, the option to have a WFM Fill is active.
WFM FIll
You can select WFM Fill from the Toolbar button or by selecting from the menu ANALYSIS | WFM Fill
Trend Plot with Min Max and Avg
The following is an example of the different display possibilities for a waveform that offers min, max and average trace values.
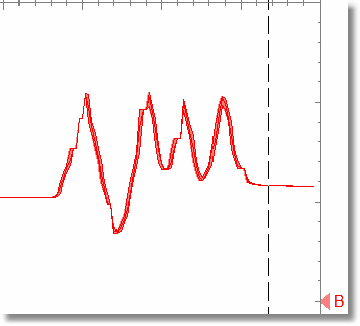
Waveform with min, max, and average values displayed. Wfm Fill is on.
|
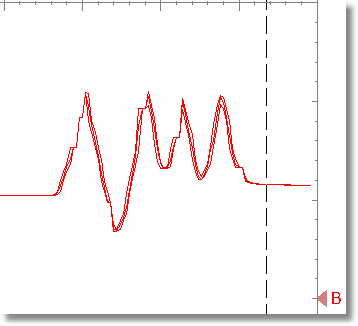
Waveform with min, max and average values displayed. Wfm Fill is off. |
|
|
|
|
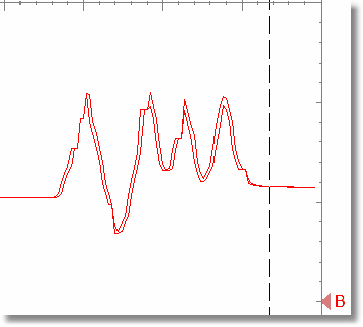
Waveform with min and max values displayed. Average is off. Wfm Fill is off.
|
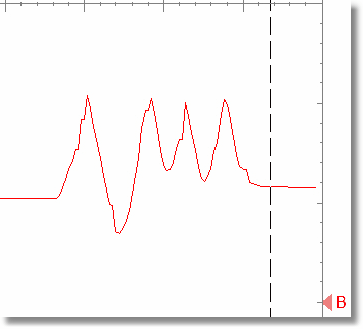
Waveform with min and max values off and only average on. Wfm Fill is off. |
|
|
|
|
More examples
Both waveforms have min and max values. Red with fill off. Blue with fill on.
|
Green - min max with fill on. Red is a single trace with no min max. |
|
|
|
|
